


Indicator Level
Indicator Wording
Indicator Purpose
How to Collect and Analyse the Required Data
Determine the indicator's value by using the following methodology:
1) Conduct interviews with representatives of a representative sample of target households. In each household, interview an adult who knows about the household's food consumption and coping practices, preferably someone involved in obtaining or preparing food. Ask on how many days during the previous seven days the household used each of the five coping strategies listed below because it lacked sufficient food or money to obtain food. Record the frequency by entering the relevant number (e.g. 0 – did not have to use the coping strategy; 2 – had to use it two days; 7 – had to use it every day in the past 7 days).
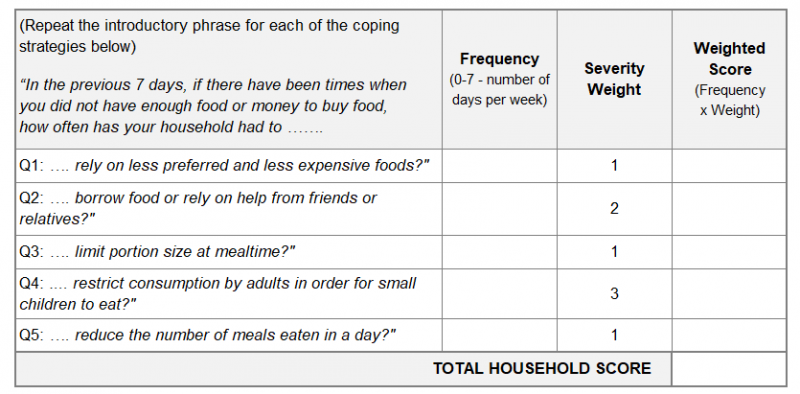
2) During the data analysis, for each coping strategy, multiply the ‘frequency’ by the assigned ‘severity weight’, thereby getting a ‘weighted score’ per each strategy.
3) Add up the scores of all assessed strategies to receive the household’s rCSI score. A high score means extensive use of negative coping strategies and hence increased food insecurity (the maximum score for the rCSI is 56; this would happen if a household used all five strategies every day for the last 7 days).
4) To calculate the indicator’s values:
to calculate the mean rCSI, add the valid household rCSI scores and divide by the number of households with valid scores (all five coping strategy responses completed)
to calculate the median value of rCSI, arrange all household rCSI scores in ascending order and identify the middle value (or average the two middle values if there is an even number of households)
Disaggregate by
This data can be disaggregated by geographical area, gender of the household head and, if relevant and feasible, also by displacement status, wealth group, and disability status of household members, provided subgroup sample sizes are sufficient for reliable interpretation.
Important Comments
1) To help explain the rCSI score, also report the proportions of households that relied on each individual coping strategy during the previous seven days. For each strategy, divide the number of households that used it on at least one day by the number of households with a valid response to that strategy. Multiply the result by 100 to convert it to a percentage.
2) The rCSI can vary considerably with seasonal changes in food access. Therefore, collect baseline and endline data at the same time of year, where possible, or monitor regularly across seasons. When interpreting changes, also consider major shocks, food prices and the timing of food or cash assistance.
3) If you use the link to the electronic questionnaire below, the values have been limited to a range between 0 and 7. If you use your own template, record the values as whole numbers between 0 and 7. Values greater than 7 should be replaced with 7, and any negative values (which may occur due to data entry errors) should be replaced with 0. Record “don’t know” or “not applicable” responses as missing.
4) Calculate the rCSI only if all five coping strategy items have valid (0–7) responses. If one or more items are missing, mark the household's rCSI as missing to avoid partial or biased results.
5) It is recommended to calculate both the mean and the median, as they provide different information. The mean shows the average household rCSI score, while the median shows the middle score and is less affected by extreme values. Reporting both helps interpret the distribution of coping behaviours across households.
6) The rCSI does not have thresholds that are universally valid for all purposes. Some established food security frameworks use specific rCSI thresholds, while Food Security Clusters, governments or donors may define thresholds for particular reporting or decision-making purposes. Use only thresholds appropriate to the intended purpose. When reporting the percentage of households meeting a threshold, state the exact cut-off, its source and whether scores equal to the threshold are included.
7) Do not use an rCSI score or threshold as a direct criterion for selecting households for food assistance. The indicator is suitable for population-level analysis, geographic targeting and outcome monitoring, but individual household scores reflect recent coping behaviour and can be difficult to verify. For beneficiary selection, use transparent, context-specific and verifiable vulnerability criteria.
8) A low rCSI score does not necessarily mean that a household is food secure. The rCSI measures recent food-related coping, not all dimensions of food security. Interpret results alongside other relevant indicators, such as the Food Consumption Score (FCS), especially where households may have exhausted their coping options.
9) DG ECHO uses the following wording for its rCSI Key Outcome Indicator: “% of the target population with a reduced Coping Strategy Index (rCSI) lower than 18.” This differs from reporting mean and median rCSI scores.
Relevant Sectoral Indicators
Also consider using the following indicators:
Food Consumption Score (assesses recent household food consumption and helps interpret changes in coping behaviour)
Livelihood Coping Strategies – Food Security (LCS-FS) (captures longer-term livelihood coping and possible depletion of household resources)
Household Hunger Scale (helps identify severe household food deprivation that rCSI alone may not adequately capture)
Coping Strategy Index (provides a context-specific alternative when locally relevant consumption coping strategies need to be measured)
Relevant Cross-cutting Indicators
Also consider using the following indicators:
Assistance Delivery (assesses whether food or cash assistance is delivered safely, accessibly and accountably, helping identify problems that may prevent households from receiving support)
Perception of Equal Opportunities (assesses whether different population groups perceive that they have equal opportunities to benefit from assistance, helping identify potential gender, age and inclusion barriers)