

Indicator Level
Indicator Wording
Indicator Purpose
How to Collect and Analyse the Required Data
Determine the indicator's value by using the following methodology:
1) Conduct individual interviews with a representative sample of the target group members, asking them how many days in the previous 7 days they had to use the coping strategies listed below. Use the questions provided in the left column below. Record the frequency by entering the relevant number (e.g. 0 – did not have to use the coping strategy; 2 – had to use it two days; 7 – had to use it every day in the past 7 days).
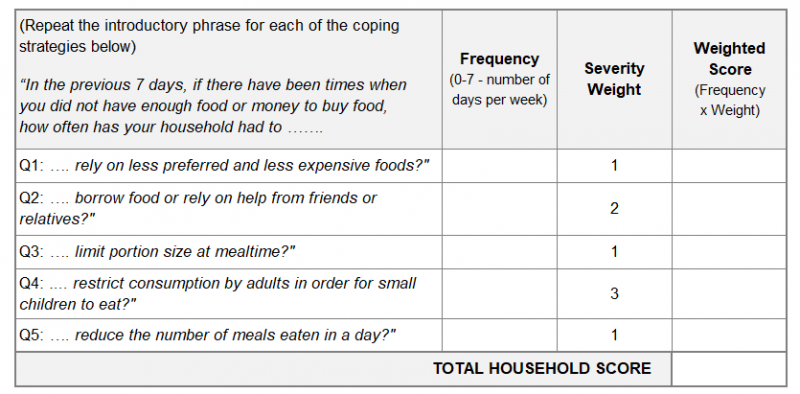
2) During the data analysis, for each coping strategy, multiply the ‘frequency’ by the assigned ‘severity weight’, thereby getting a ‘weighted score’ per each strategy.
3) Add up the scores of all assessed strategies to receive the household’s rCSI score. A high score means extensive use of negative coping strategies and hence increased food insecurity (the maximum score for the rCSI is 56; this would happen if a household used all five strategies every day for the last 7 days).
4) To calculate the indicator’s values:
to calculate the mean value of rCSI, add the rCSI scores of all the surveyed households and divide this by the total number of surveyed households
to calculate the median value of rCSI, arrange all household rCSI scores in ascending order and identify the middle value (or average the two middle values if there is an even number of households)
Disaggregate by
Disaggregate the data by gender of the head of household, geographical area, population area, wealth, and other relevant criteria, provided the sample size is sufficient to ensure reliable representation.
Important Comments
1) To help explain the rCSI score, also report the proportions of households that relied on each individual coping strategy during the previous seven days. To do so, for each coping strategy, divide the number of households that used the strategy by the total number of households surveyed. Multiply the result by 100 to convert it to a percentage.
2) The rCSI varies with significant seasonal shifts in food access. Therefore, rCSI data should be either collected continuously or, ensure that baseline and endline data are collected at the same time of a year; otherwise, it is very likely that they will not be comparable.
3) If you use the link to the electronic questionnaire below, the values have been limited to a range between 0 and 7. If you use your own template, record the values as whole numbers between 0 and 7. Values greater than 7 should be replaced with 7, and any negative values (which may occur due to data entry errors) should be replaced with 0. Record “don’t know” or “not applicable” responses as missing.
4) Calculate the rCSI only if all five coping strategy items have valid (0–7) responses. If one or more items are missing, mark the household’s rCSI as missing to avoid partial or biased results.
5) It is recommended to calculate both the mean and the median because they show different things about the data. The mean is the average of all values but can be affected by very high or very low numbers. The median is the middle value and is not affected by extreme values. When both are shown, it helps to understand if most people’s situations are typical or if some extreme cases are changing the average. This makes it easier to get a clearer picture of the overall situation.
6) The rCSI doesn’t have universal thresholds. In some contexts, the Food Security Cluster, government, or sometimes donors, agree on a context-specific threshold for reporting and decision-making. Where such a threshold exists, report the percentage of households with an rCSI that is higher or equal to the threshold. This helps show severity, compare areas and time periods, as well as trigger programs when needed. Always make sure to state the threshold value and its source (e.g. cluster guidance) and do not apply a threshold unless formally agreed.
7) DG ECHO uses the following wording for its rCSI Key Outcome Indicator: “% of the target population with a reduced Coping Strategy Index (rCSI) lower than 18.”